Advice for graduates applying for data science jobs

2019-08-01 update

Things were a little different when I wrote this in 2017. These days I constantly see new/junior data scientists get rejected because they don’t have the experience. Even those who have an impressive portfolio of projects to show off that they have the technical know-how get thumbs down. I firmly believe this is a failure of employers, not the new generation of recently graduated data scientists entering the field.
Mostly-free resources for learning data science

In the past year or two I’ve had several friends approach me about learning statistics because their employer/organization was moving toward a more data-driven approach to decision making. (This brought me a lot of joy.) I firmly believe you don’t actually need a fancy degree and tens of thousands of dollars in tuition debt to be able to engage with data, glean insights, and make inferences from it. And now, thanks to many wonderful statisticians on the Internet, there is now a plethora of freely accessible resources that enable curious minds to learn the art and science of statistics.

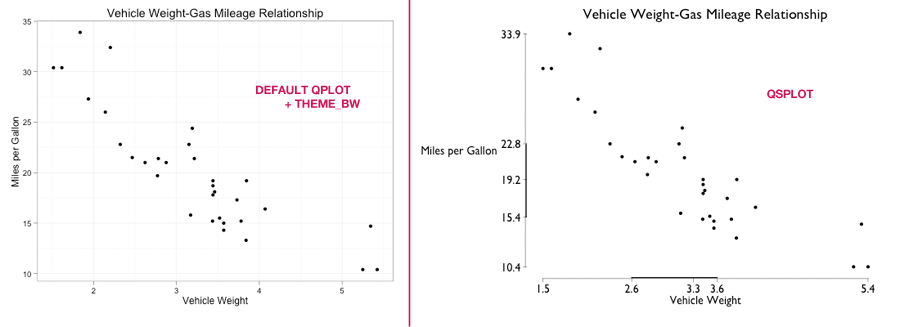
Quartile-Frame Scatterplot with ggplot2

Inspired by The Visual Display of Quantitative Information by Edward R. Tufte

The goal is to make the axes tell a better story about the data. This is done by turning the axes into quartile plots (cleaner boxplots).

Usage Example:

Only x and y are required, everything else is optional.

qsplot(
  x = mtcars$wt, y = mtcars$mpg,
  main = "Vehicle Weight-Gas Mileage Relationship",
  xlab = "Vehicle Weight", ylab = "Miles per Gallon",
  font.family = "Gill Sans" # alternatively: "Times New Roman"
)

The R code can be found on GitHub.