Resources for learning to visualize data with R/ggplot2
I’m currently learning visualisation with R/ggplot2 and was wondering whether you could share tips/links/videos/books/resources that helped you in your journey :-)
Sure! Here ya go:
Tips
The only tip I’ll give is that you should strive to make every chart look exactly how you want it to look and say exactly what you want it to say. You will learn in the process of doing. When it’s time to visualize the data and you have an idea for a very specific look and story, don’t give it up or compromise on your vision just because you don’t know how to do it. Trust me, there is so much documentation out there and so many posts on Stack Overflow that you will be able to figure it out. (But also it’s totally fine to get 90-95% of the way there and call it done if that last 5-10% sprint is driving you bonkers.)
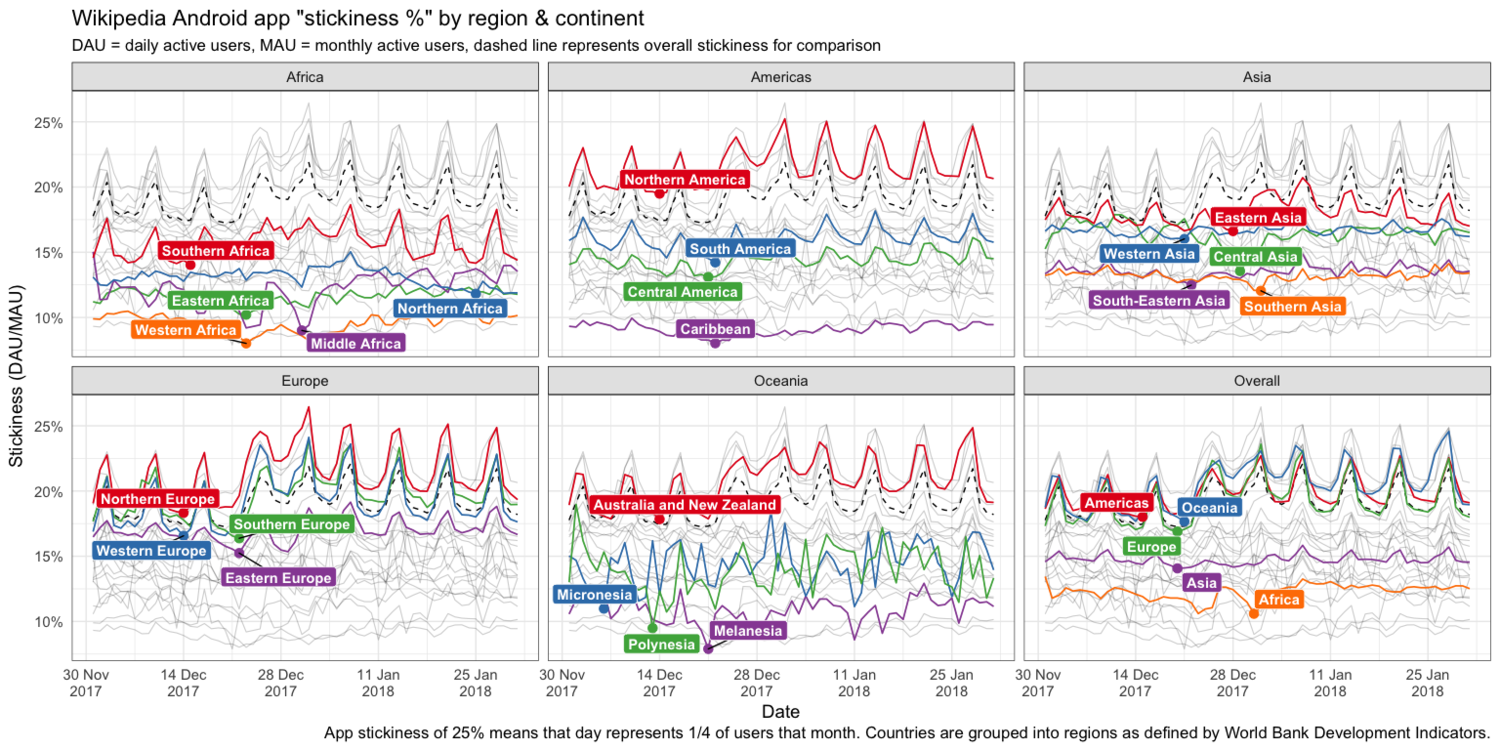
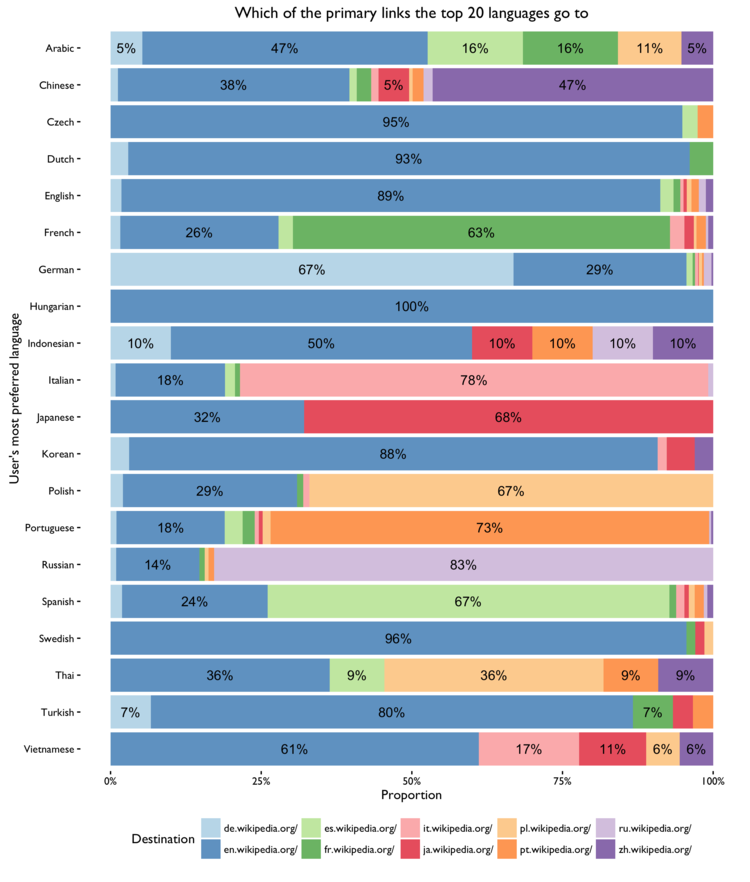
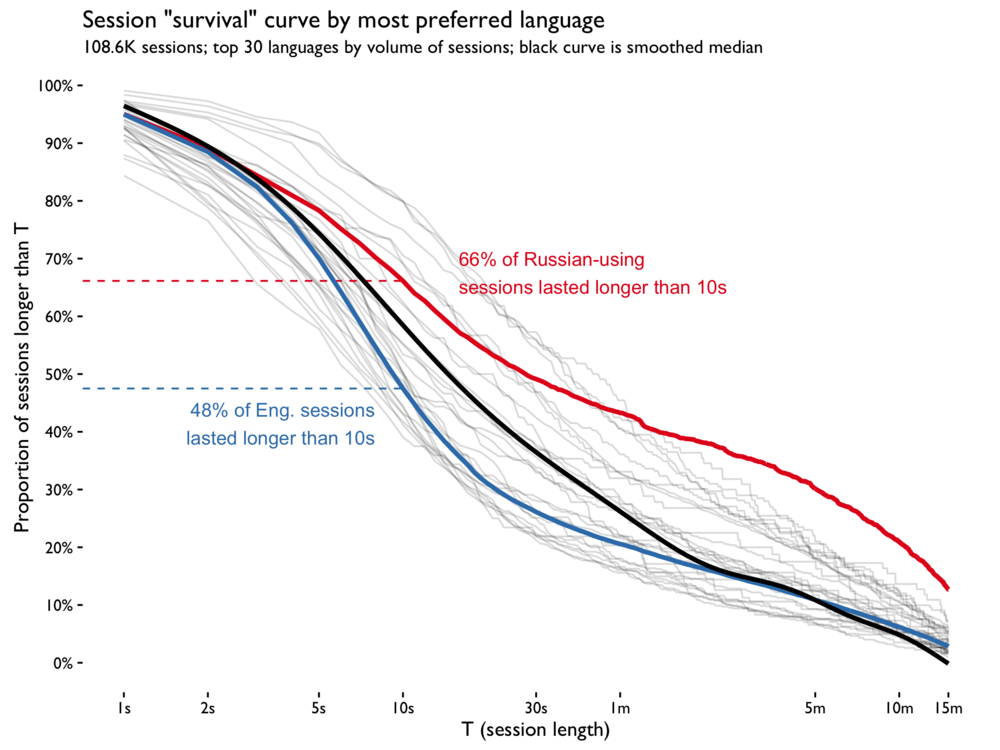
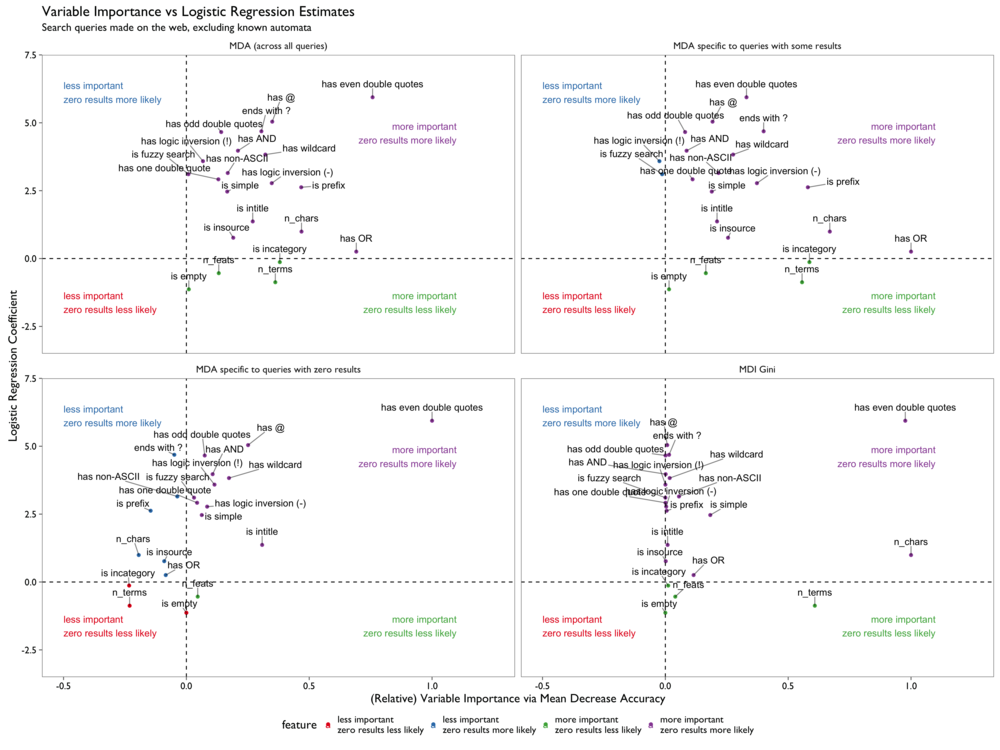
Here are some charts I made in the past two and a half years at The Wikimedia Foundation:
| Example 1 | Example 2 | Example 3 | Example 4 |
|---|---|---|---|
 |
 |
 |
 |
| Code | Code | Code | Code |
In each case I distinctly remember wanting to express an idea in a specific way and had to learn something new or learn how to think about a problem in a new way. If you click on one of those, you will see a link to its source code on GitHub that you are welcome to look at and learn from.
Resources
I would recommend checking out the following:
- Videos
- Books
- Others
- Cookbook for R
- Data Visualization chapter in R for Data Science
- R graphics tutorial from the Institute For Quantitative Social Science at Harvard
- Blogs & Microblogs
…and many more! There are a lot of folks sharing their knowledge and techniques out there, and I cannot stress enough how many of them you can find out by going through Mara’s exhaustive catalogue of cool things made by people in R.
Also, it just dawned on me that I can totally make this a series. I’ve previously written blog posts as responses to the following questions:
- Do you have any recommendations for learning statistics on budget?
- Do you have advice for graduates applying for data science jobs?
- I’m interested in learning more about you and your journey to where you are today
So I’ve gone back and added the new Ask Popov tag to those. Hopefully there will be more questions because these advice posts feel good to write!