R

Wikipedia Preview for R Markdown documents

Wikipedia Preview (developed by Wikimedia’s Inuka team) is so cool: When readers navigate in and out of a webpage through interacting with several hyperlinks, they can easily lose context of what they were reading in the first place. Content sites would like their readers to read and engage with their content and understand it without having to get contextual information elsewhere. Wikipedia Preview can solve this problem for content providers by allowing readers to have concise and visual contextual information from Wikipedia within a content provider’s mobile properties - website or webapp.

Making Of: Session Tick visualization

In this post I will walk through my R code for a data visualization I created for the session length dataset project at the Wikimedia Foundation.

Animation of optimization in torch

In this post I will show you how to use the {gganimate} R package to make an animated GIF illustrating Adam optimization of a function using {torch}: library(torch) library(gganimate) library(tidyverse) We will use torch::optim_adam() to find the value of x that minimizes the following function: f <- function(x) (6 * x - 2) ^ 2 * sin(12 * x - 4) The function looks as follows: The adam_iters dataset will contain an iter column (for the iteration/step identifier) and an x column (the value of x after each iteration):

Pivoting posteriors

In Stan, when a parameter is declared as an array, the samples/draws data frame will have columns that use the [i] notation to denote the i-th element of the array. For example, suppose we had a model with two parameters – (\lambda_1) and a (\lambda_2). Instead of declaring them individually – e.g. lambda1 and lambda2, respectively – we may declare them as a single lambda array of size 2: parameters { real lambda[2]; } When we sample from that model, we will end up with samples for lambda[1] and lambda[2].

Using R to help my wife manage Sims screenshots

I grew up with The Sims and remember spending what is probably hundreds of hours of my childhood with that game, so it was a special feeling to share that with my wife and introduce her to The Sims 3 a few years ago. Coming from Animal Crossing: Happy Home Designer, the expanded toolset for interior design (AND addition of architecture tools) hooked her, but she wasn’t that into the non-building part of playing The Sims.

Replacing the knitr engine for Stan

2020-08-03 UPDATE: Good news! A version of this engine is now included in versions 0.1.1 and later of {CmdStanR}. Use cmdstanr::register_knitr_engine() at the top of the R Markdown document to register it as the engine for stan chunks. See the vignette R Markdown CmdStan Engine for examples. Shoutout to the maintainers Jonah Gabry & Rok Češnovar for a super positive code review experience with the pull request for this. I originally dabbled with custom {knitr} engine creation last month, when I made {dotnet} which enables R Markdown users to write chunks with C# and F# programs in them.

Introducing ‘dotnet’ knitr engine for C# & F# chunks in R Markdown

I had a thought “wouldn’t it be cool to do a blog post about Bayesian inference with Infer.NET?” and then a follow-up thought “wouldn’t it be even cooler to have the probabilistic programs as R Markdown chunks that would be actually built/compiled and then run/executed just like Python and Julia chunks would be?” And that’s how I ended up spending an evening learning how to make custom language engines for {knitr} and making one for C# and F# languages.

Strings in R 4.x vs 3.x (and earlier)

Among the several user-facing changes listed in R 4.0.0’s release notes was this point: There is a new syntax for specifying raw character constants similar to the one used in C++: r"(…)" with … any character sequence not containing the sequence )". This makes it easier to write strings that contain backslashes or both single and double quotes. For more details see ?Quotes. To get a better sense of this (wonderful) feature addition, I thought it’d be useful to see some before/after examples.

Approximating probabilities

A tutorial on using R and Monte Carlo simulation as a substitute for analytical solutions to “what is the probability of?” problems.

Faster matrix math in R on macOS

Update (October 2021): macOS 10.14 “Big Sur” and later do not ship with Accelerate BLAS dynamic libraries in the filesystem, so this trick only works up to macOS 10.13 “High Sierra” If you want faster matrix operations in R on your Mac, you can use Apple’s BLAS (Basic Linear Algebra Subprograms) library from their Accelerate framework instead of the library which comes with the R binary that you get from CRAN.

Bayesian Optimization in R

A tutorial on using Bayesian optimization to find the minimum of a function with only a few evaluations of the functions, using different approaches to identify the best next value to evaluate the function at.

Resources for learning to visualize data with R/ggplot2

I’m currently learning visualisation with R/ggplot2 and was wondering whether you could share tips/links/videos/books/resources that helped you in your journey :-) Sure! Here ya go: Tips The only tip I’ll give is that you should strive to make every chart look exactly how you want it to look and say exactly what you want it to say. You will learn in the process of doing. When it’s time to visualize the data and you have an idea for a very specific look and story, don’t give it up or compromise on your vision just because you don’t know how to do it.

Installing GPU version of TensorFlow™ for use in R on Windows

Intro The other night I got TensorFlow™ (TF) and Keras-based text classifier in R to successfully run on my gaming PC that has Windows 10 and an NVIDIA GeForce GTX 980 graphics card, so I figured I’d write up a full walkthrough, since I had to make minor detours and the official instructions assume – in my opinion – a certain level of knowledge that might make the process inaccessible to some folks.

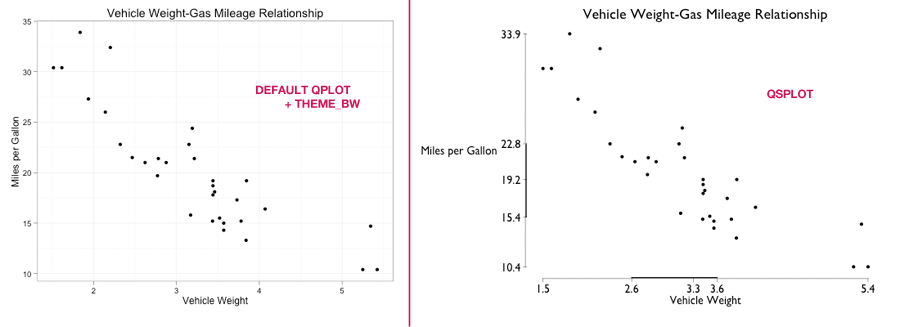
Quartile-Frame Scatterplot with ggplot2

Inspired by The Visual Display of Quantitative Information by Edward R. Tufte The goal is to make the axes tell a better story about the data. This is done by turning the axes into quartile plots (cleaner boxplots). Usage Example: Only x and y are required, everything else is optional. qsplot( x = mtcars$wt, y = mtcars$mpg, main = "Vehicle Weight-Gas Mileage Relationship", xlab = "Vehicle Weight", ylab = "Miles per Gallon", font.

Guide to Shiny apps with Shiny Server on Amazon EC2

Preface: posting this for archive purposes only. This was the first of its kind and has been succeeded by better guides. Introduction I am writing this guide because this guide did not exist when I decided to put my 2010 US Census Shiny App on Amazon’s servers. Surely I can’t be the only one who’s never had any experience with EC2 (or SSH or vi, for that matter). So here’s a newbie’s guide to newbies for deploying your rad Shiny app on Amazon Elastic Compute Cloud (EC2) from scratch.