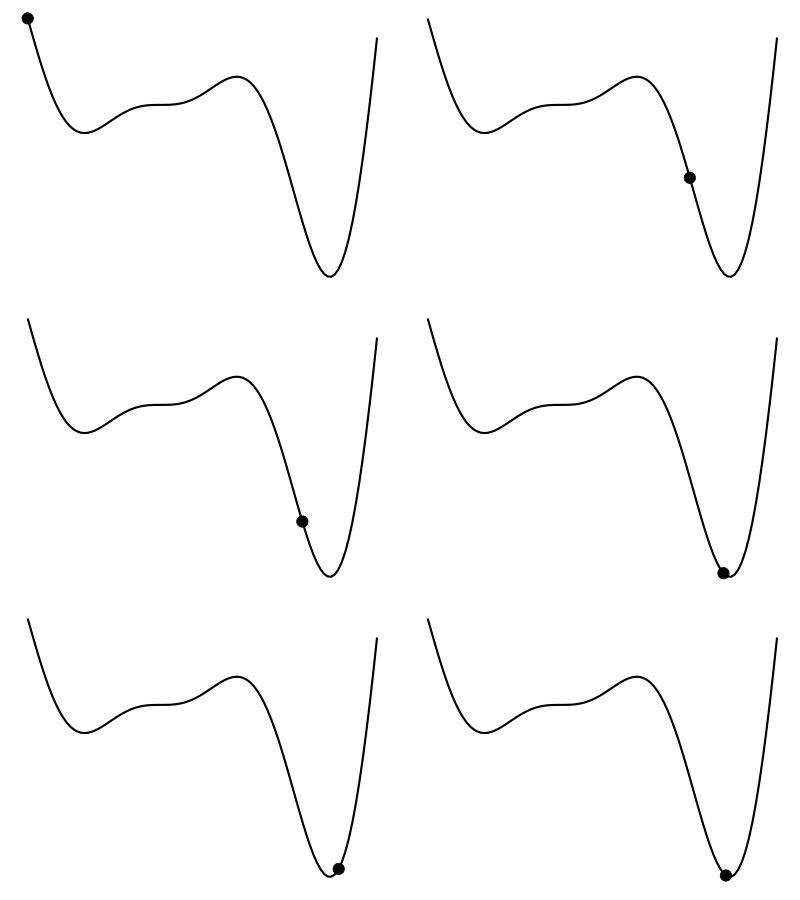
Animation of optimization in torch
In this post I will show you how to use the {gganimate} R package to make an animated GIF illustrating Adam optimization of a function using {torch}:

library(torch)
library(gganimate)
library(tidyverse)
We will use
torch::optim_adam() to find the value of x that minimizes the following function:
f <- function(x) (6 * x - 2) ^ 2 * sin(12 * x - 4)
The function looks as follows:
The adam_iters dataset will contain an iter column (for the iteration/step identifier) and an x column (the value of x after each iteration):
adam_iters <- (function(n_iters, learn_rate) {

  x <- torch_zeros(1, requires_grad = TRUE)

  f <- function(x) (6 * x - 2)^2 * torch_sin(12 * x - 4)

  optimizer <- optim_adam(x, lr = learn_rate)

  iters <- tibble(
    iter = 1:n_iters,

    x = replicate(n_iters, {
      # Evaluate at current value of x:
      y <- f(x)
      # Zero out the gradients before the backward pass:
      optimizer$zero_grad()
      # Compute gradient on evaluation tensor:
      y$backward()
      # Update value of x:
      optimizer$step()
      # Remember updated value of x:
      as.numeric(x)
    })
  )

  # Add starting value and return:
  bind_rows(tibble(iter = 0, x = 0), iters)

})(n_iters = 50, learn_rate = 0.25)
If you’re interested in learning more about this, I encourage you to read the {torch} documentation on creating a neural network from scratch.
First, let’s just see a static (non-animated) version, where all the iterations are plotted together:
ggplot(adam_iters) +
  geom_function(fun = f, size = 1, n = 100) +
  geom_point(aes(x = x, y = f(x)), size = 5)
All we need to do is spread the iterations out in time with gganimate::transition_manual():
anim <- ggplot(adam_iters) +
  geom_function(fun = f, size = 1, n = 100) +
  geom_point(aes(x = x, y = f(x)), size = 5) +
  transition_manual(iter)

anim <- anim +
  scale_y_continuous(name = NULL, breaks = NULL, minor_breaks = NULL) +
  scale_x_continuous(name = NULL, breaks = NULL, minor_breaks = NULL)
Since I’m using it on a {blogdown} site, I’ve chosen to manually save the GIF that you saw at the top of this post:
gif <- animate(
  anim,
  fps = 15, width = 400, height = 300,
  # bg = "transparent",
  dev = "ragg_png" # requires {ragg}
)
anim_save("adam-animated.gif", gif, path = here("static", "images"))
- Posted on:
- February 28, 2021
- Length:
- 2 minute read, 366 words